Shopify Conversion Measurement: Calculate Incremental Chatbot Revenue
Quick Summary: Most Shopify chatbot dashboards report sales that happened near a chat, not the revenue the bot actually caused. To get real incremental revenue, run a control test: split traffic or match by source, then subtract the control group's conversion rate from the chatbot group's and multiply by chatbot sessions and average order value. The article's example turns a raw $7,200 into $3,600 in true lift. Report attributed revenue and estimated lift as separate numbers so you never double-count.
A Shopify order placed after a shopper chats with your bot is easy to tag. The harder question: would that order have happened without the conversation? Most dashboards report associated sales, not true incremental chatbot revenue Shopify stores can trust. This guide shows the difference, walks through a simple control-comparison method, and explains the limits of every estimate so you can measure incremental chatbot revenue Shopify-style, with numbers you can defend.
Step 1: Define the Chatbot Treatment and Revenue Outcome
Before you measure anything, decide what you are testing. Your chatbot treatment is the change you make: adding an AI sales assistant, turning on product recommendations, or moving the chat widget to a key page. Without a clear treatment, "chatbot sales" means nothing.
Next, pick one revenue outcome. Most Shopify merchants choose weekly order revenue, orders, or revenue per session. Write it down, with the metric, the date range, and the store segment you will watch.
Also decide what does not count. A shopper who found you through an email campaign would have bought anyway, so attribute carefully. This keeps incremental chatbot revenue on Shopify separate from sales that just happened to overlap with your chatbot.

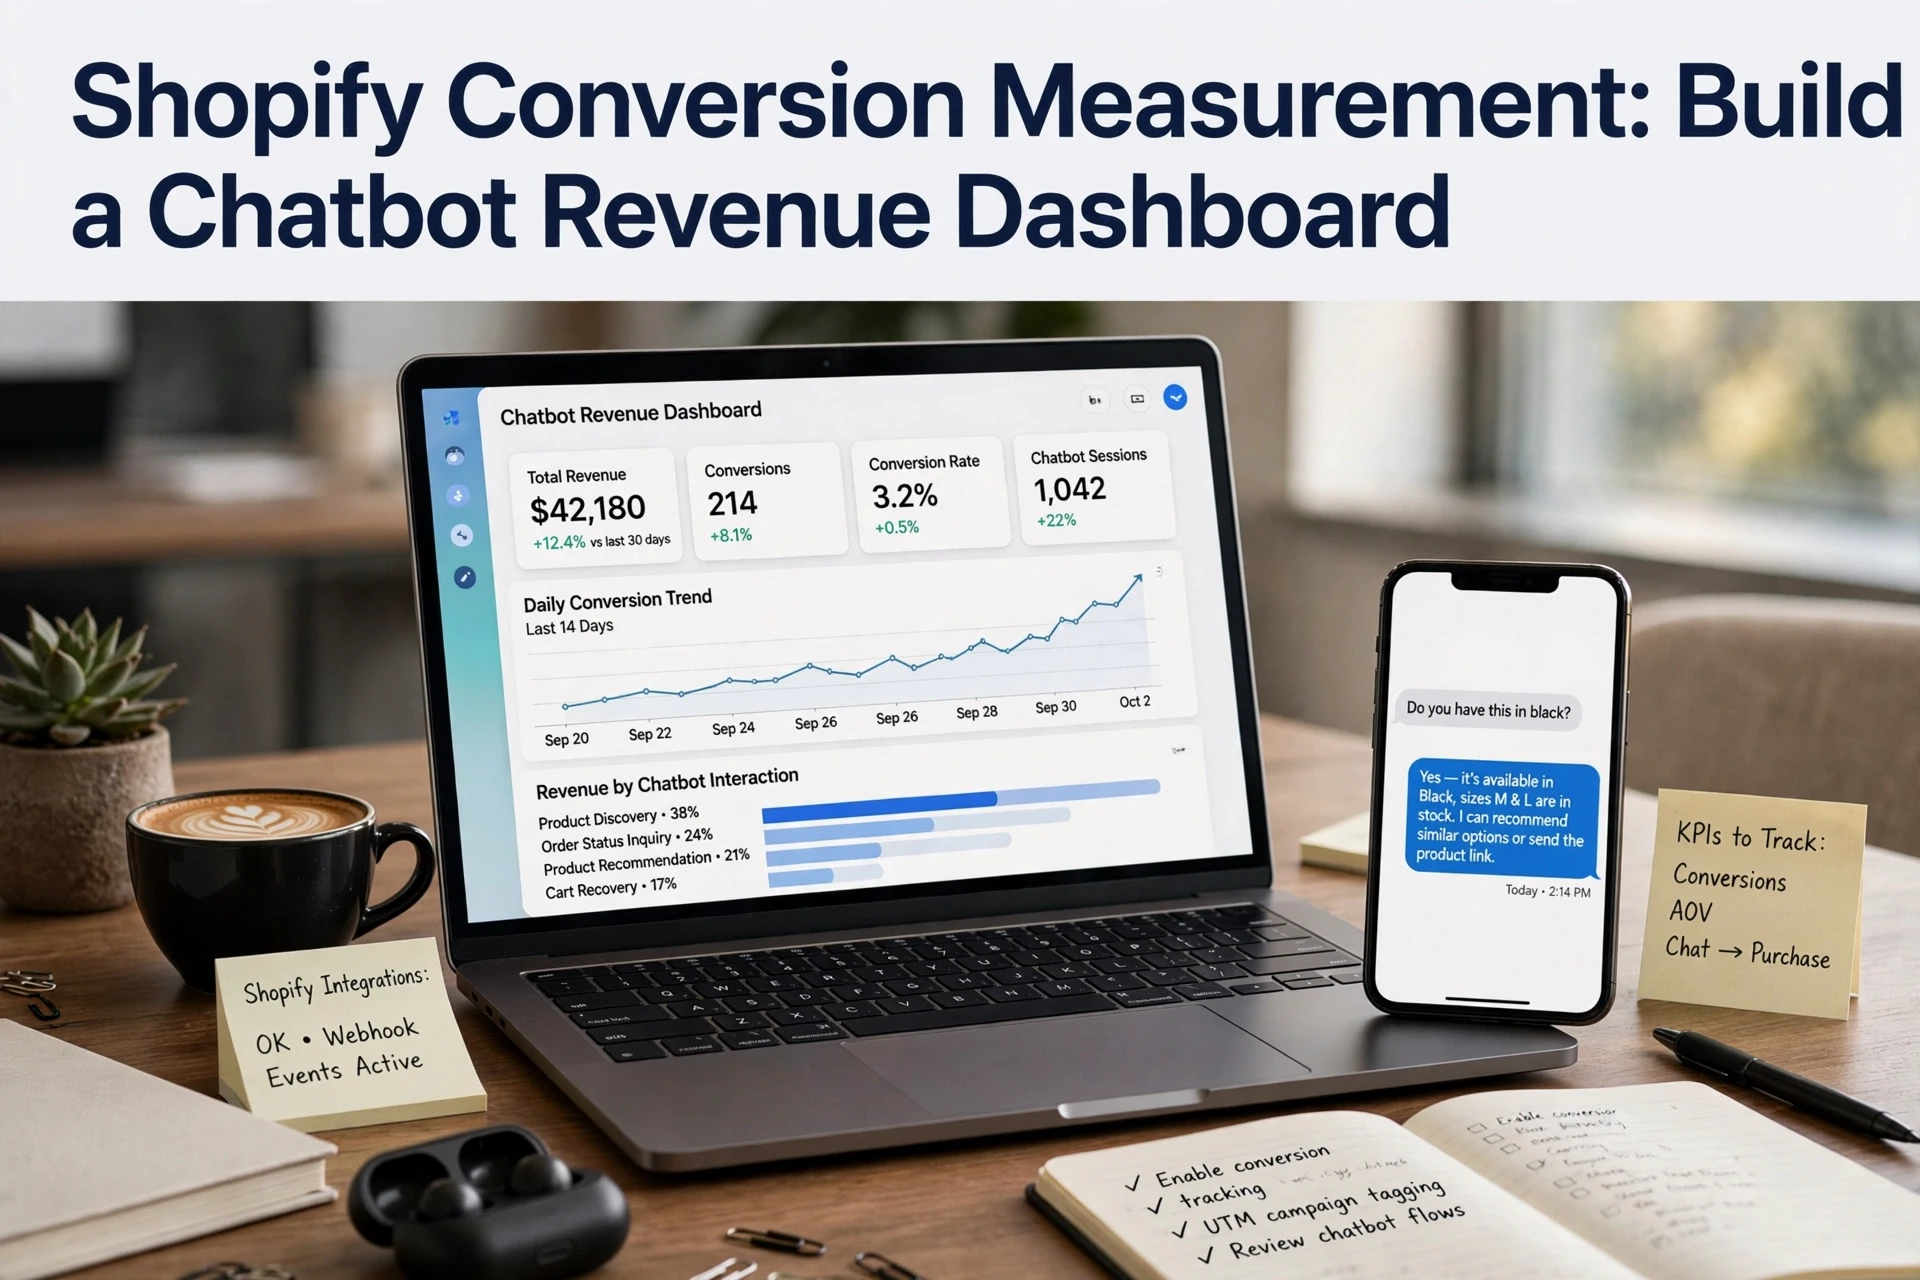
This definition step feeds directly into your chatbot revenue dashboard.
Step 2: Compare Comparable Groups With and Without the Chatbot
Keep the Groups and Test Window Comparable
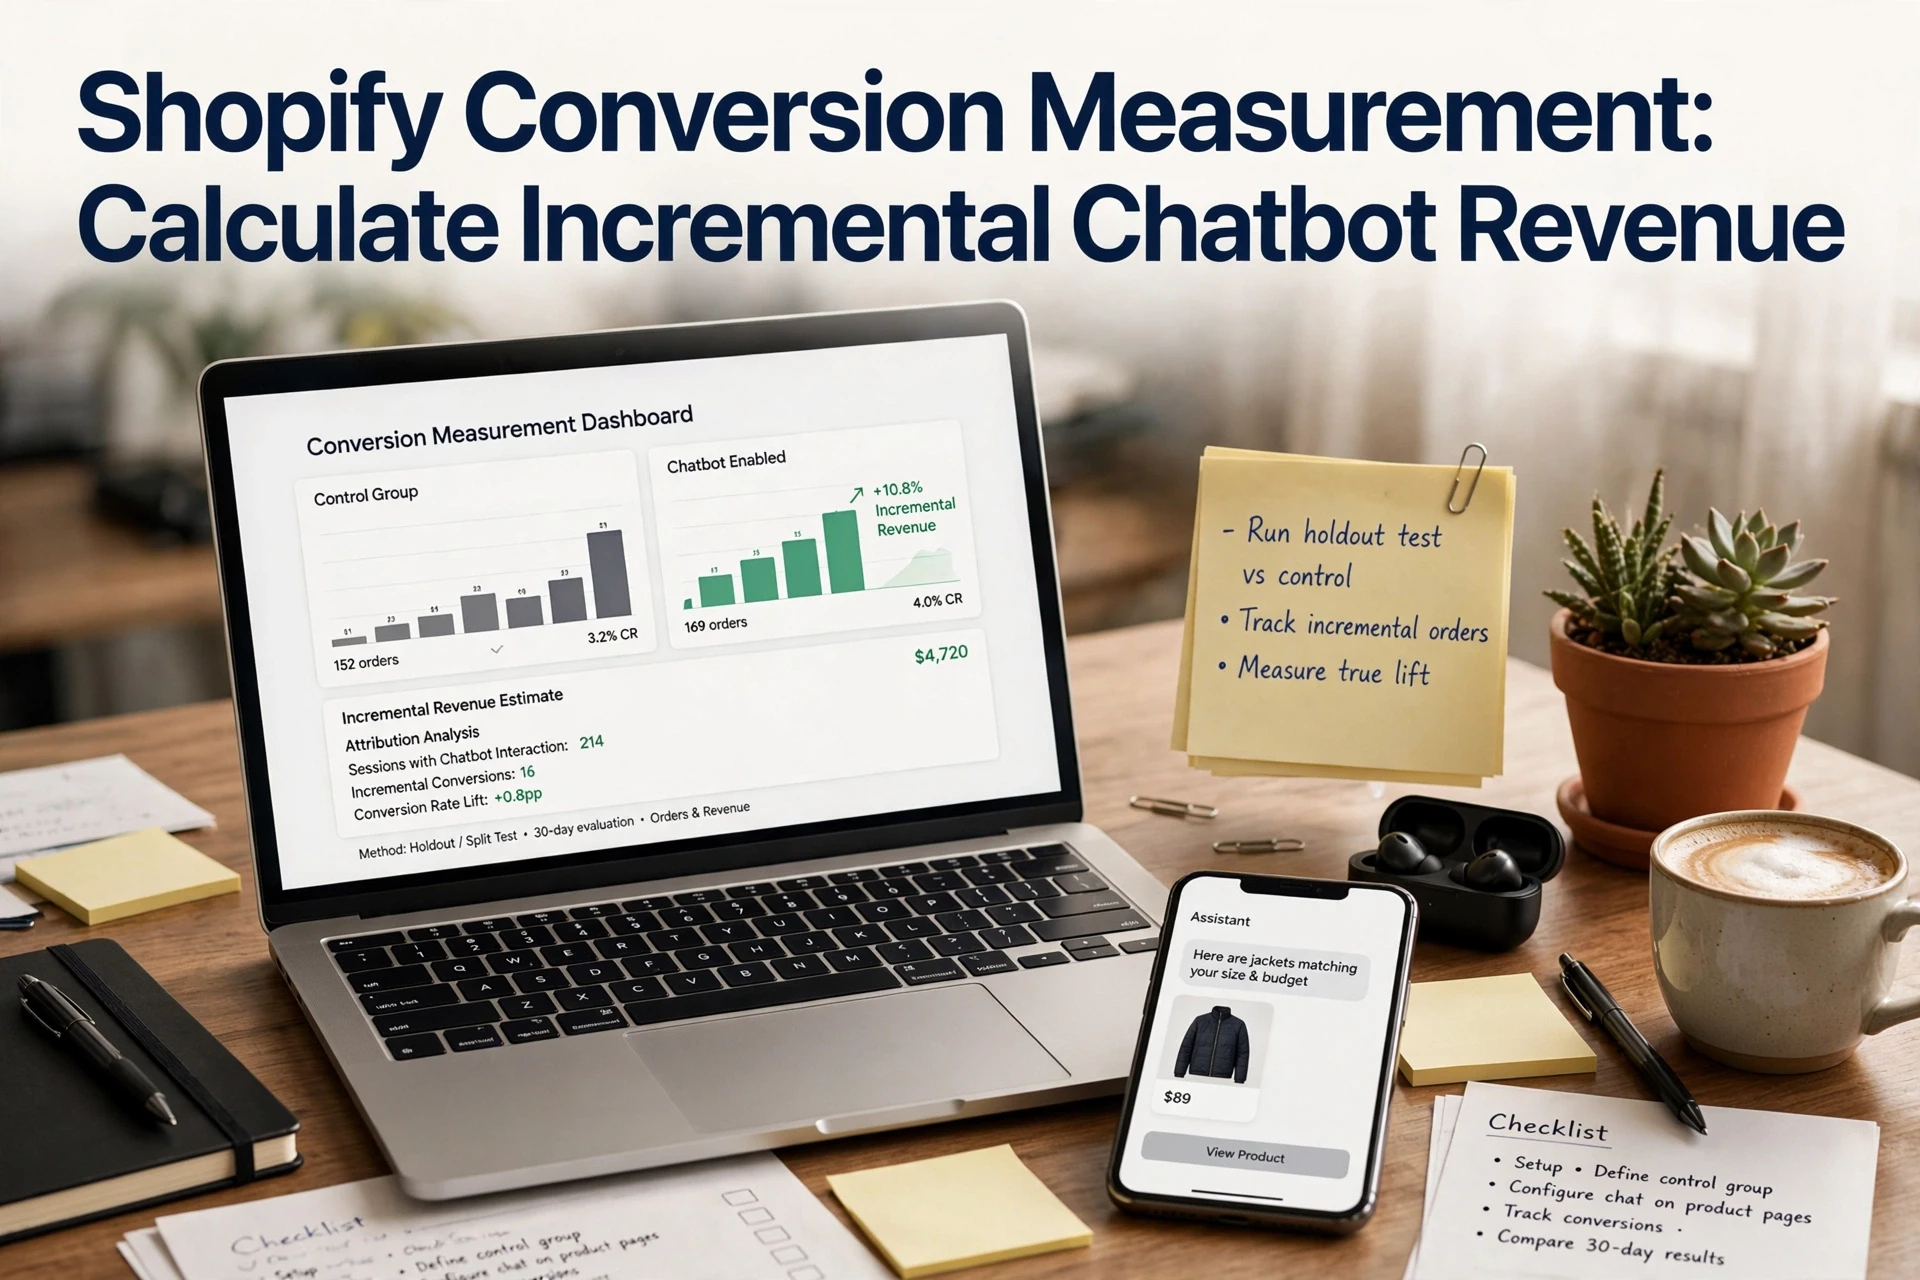
Observed sales from chats are not incremental chatbot revenue Shopify merchants can bank on. Shoppers who chat might have bought anyway. To estimate true lift, compare two similar groups: one exposed to the chatbot, one not.
Practical options:
- Split traffic randomly. Show the chatbot to 50% of sessions for two to four weeks. Compare conversion rate and revenue per session.
- Match by traffic source. If a split test is not possible, compare email traffic against email traffic, paid against paid.
- Hold the window steady. Avoid comparing a sale-heavy week against a quiet one.
Keep seasonality, discounts and ad spend the same across both groups. If they shift mid-test, your lift number is guesswork, not measurement.
Label results as estimates. A clean comparison narrows the gap between "the chatbot was there" and "the chatbot caused this."
Subtract your control group's rate from the chatbot group's rate. Then multiply the lift by chatbot sessions and average order value.
Formula: Incremental revenue = (chatbot conversion rate - control rate) x chatbot sessions x average order value.
Say 4% of chatbot sessions convert versus 2% without, across 3,000 sessions at a $60 AOV: (0.04 - 0.02) x 3,000 x $60 = $3,600 incremental, not the $7,200 the raw number suggests.
Interpret with care. This is an estimate, not a fact, because sampling noise and season can skew small tests. Run at least 100 conversions per group before you trust the result, and re-check monthly. Attribute honestly: count only sales the chat session genuinely influenced, not every order that followed one.
For tracking these numbers weekly, a simple setup like the one in our chatbot revenue dashboard guide keeps the math consistent.
Step 4: Report Attribution Separately From Estimated Lift
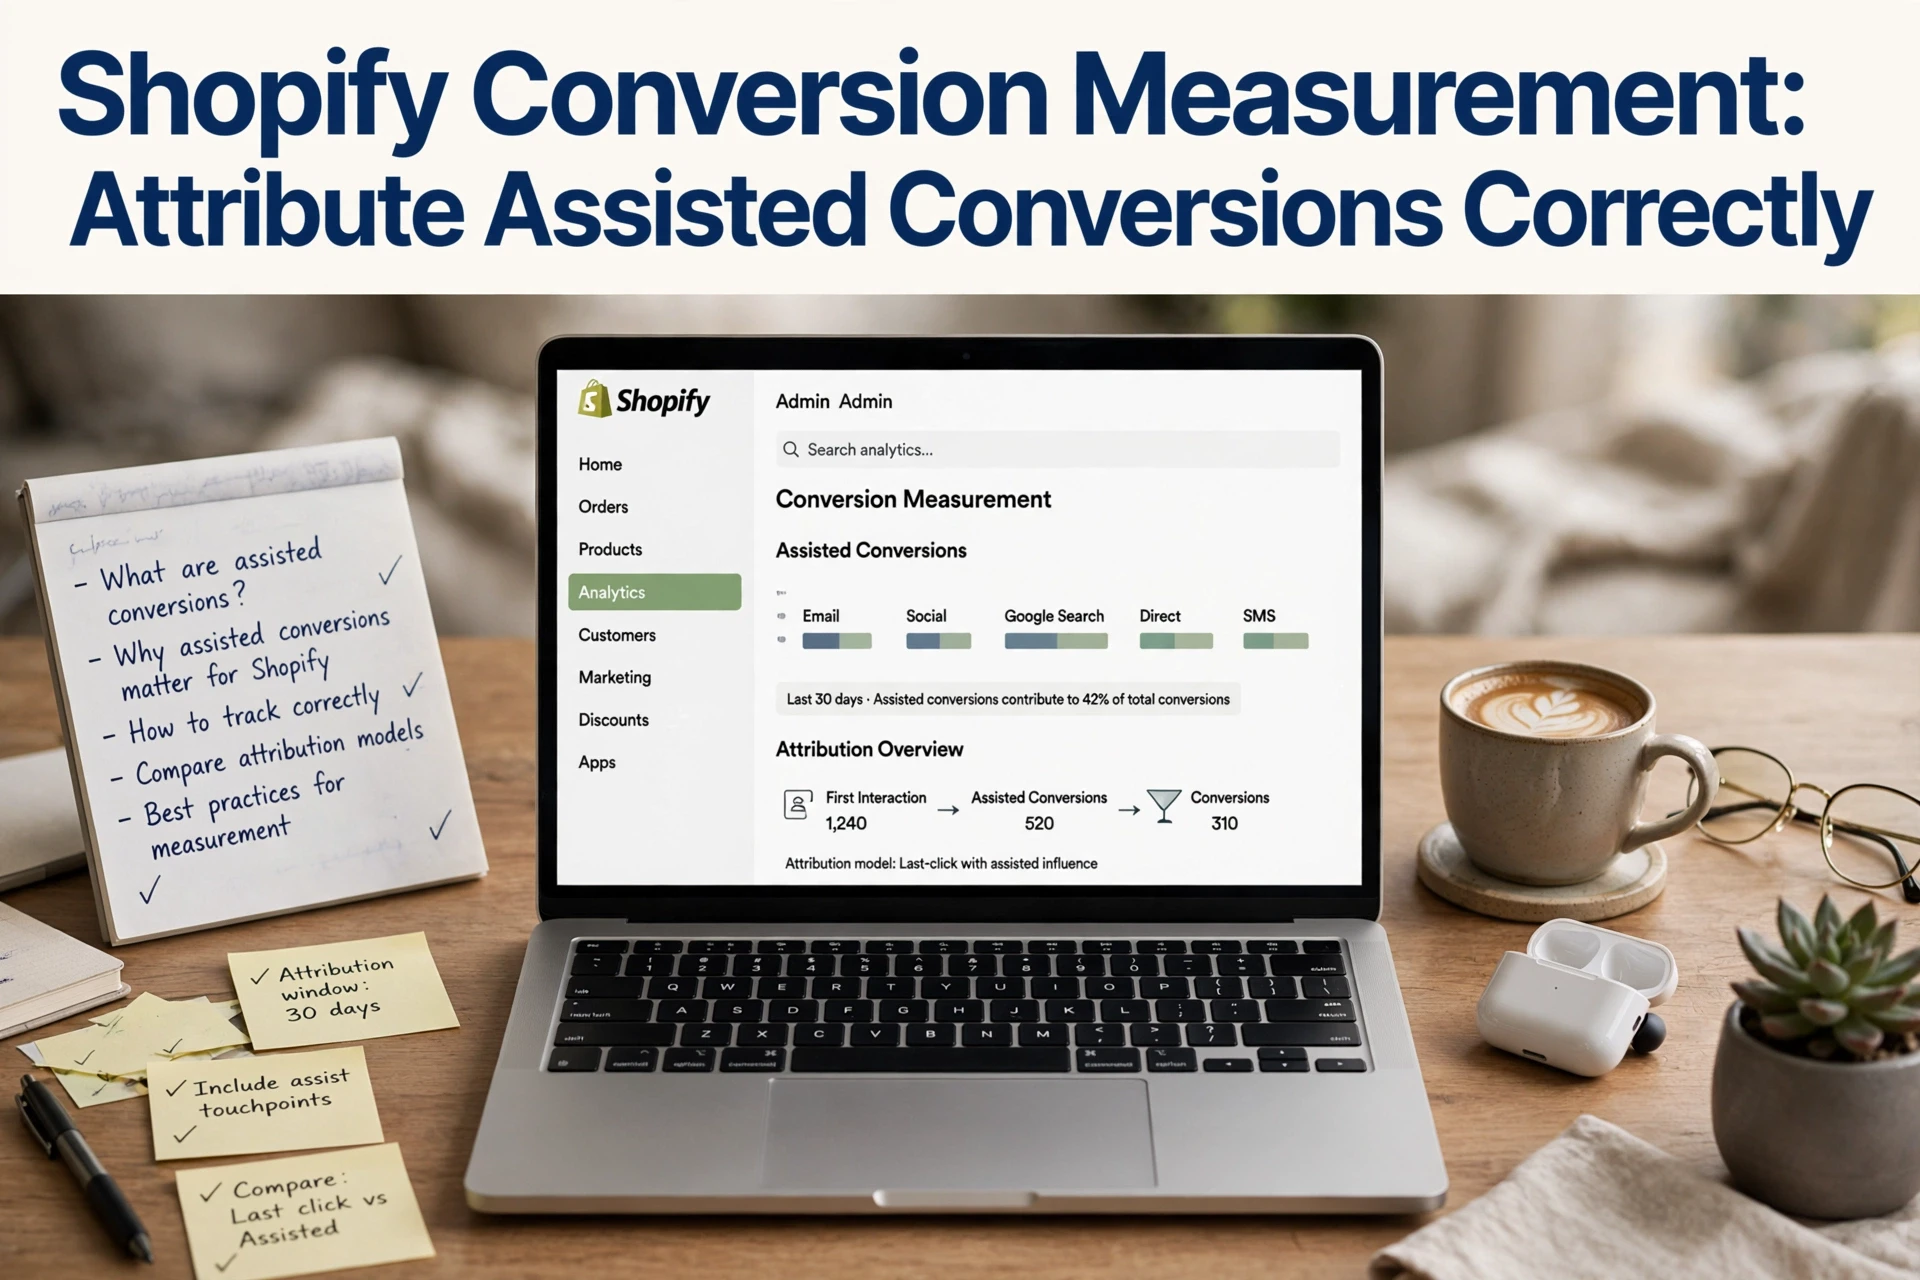
Keep two numbers on your dashboard and never merge them. The first is attributed revenue: sales where a shopper clicked the chatbot before buying. The second is estimated lift: the difference between chatbot-exposed shoppers and your control group.
Report them like this:
| Metric | What it tells you | Confidence |
|---|---|---|
| Attributed revenue | What the chatbot touched | High, but not proof of cause |
| Estimated lift | What the chatbot likely added | Moderate, depends on test setup |
| Overlap | Sales counted in both | Remove from one column |
If you merge them, you double-count and oversell the chatbot's impact. When lift runs well ahead of attributed revenue, your bot influences shoppers who never click. Measure that group with a proper test before claiming the gain. A chatbot revenue dashboard makes this split easy to keep visible week to week.
Ready to measure what your chatbot actually adds? See how Kandid helps Shopify merchants track and grow chatbot revenue.
Frequently Asked Questions
Q1: How can merchants estimate incremental revenue from Shopify chatbot interactions?
Compare chatbot users against a control group of similar shoppers without chat access, then attribute only the revenue difference, not total chat-assisted sales.
Q2: How long should a control test run?
Two to four weeks. This covers weekly buying cycles and weekend traffic swings.
Q3: What if my traffic is too low for a control group?
Use holdout days or compare periods with similar traffic, and note the limits.
Conclusion
Chatbot dashboards show sales that happened near chats. They don't prove the chatbot caused them. Compare a test group against a control, track incremental revenue over 30 days, and state your attribution limits when you report results.