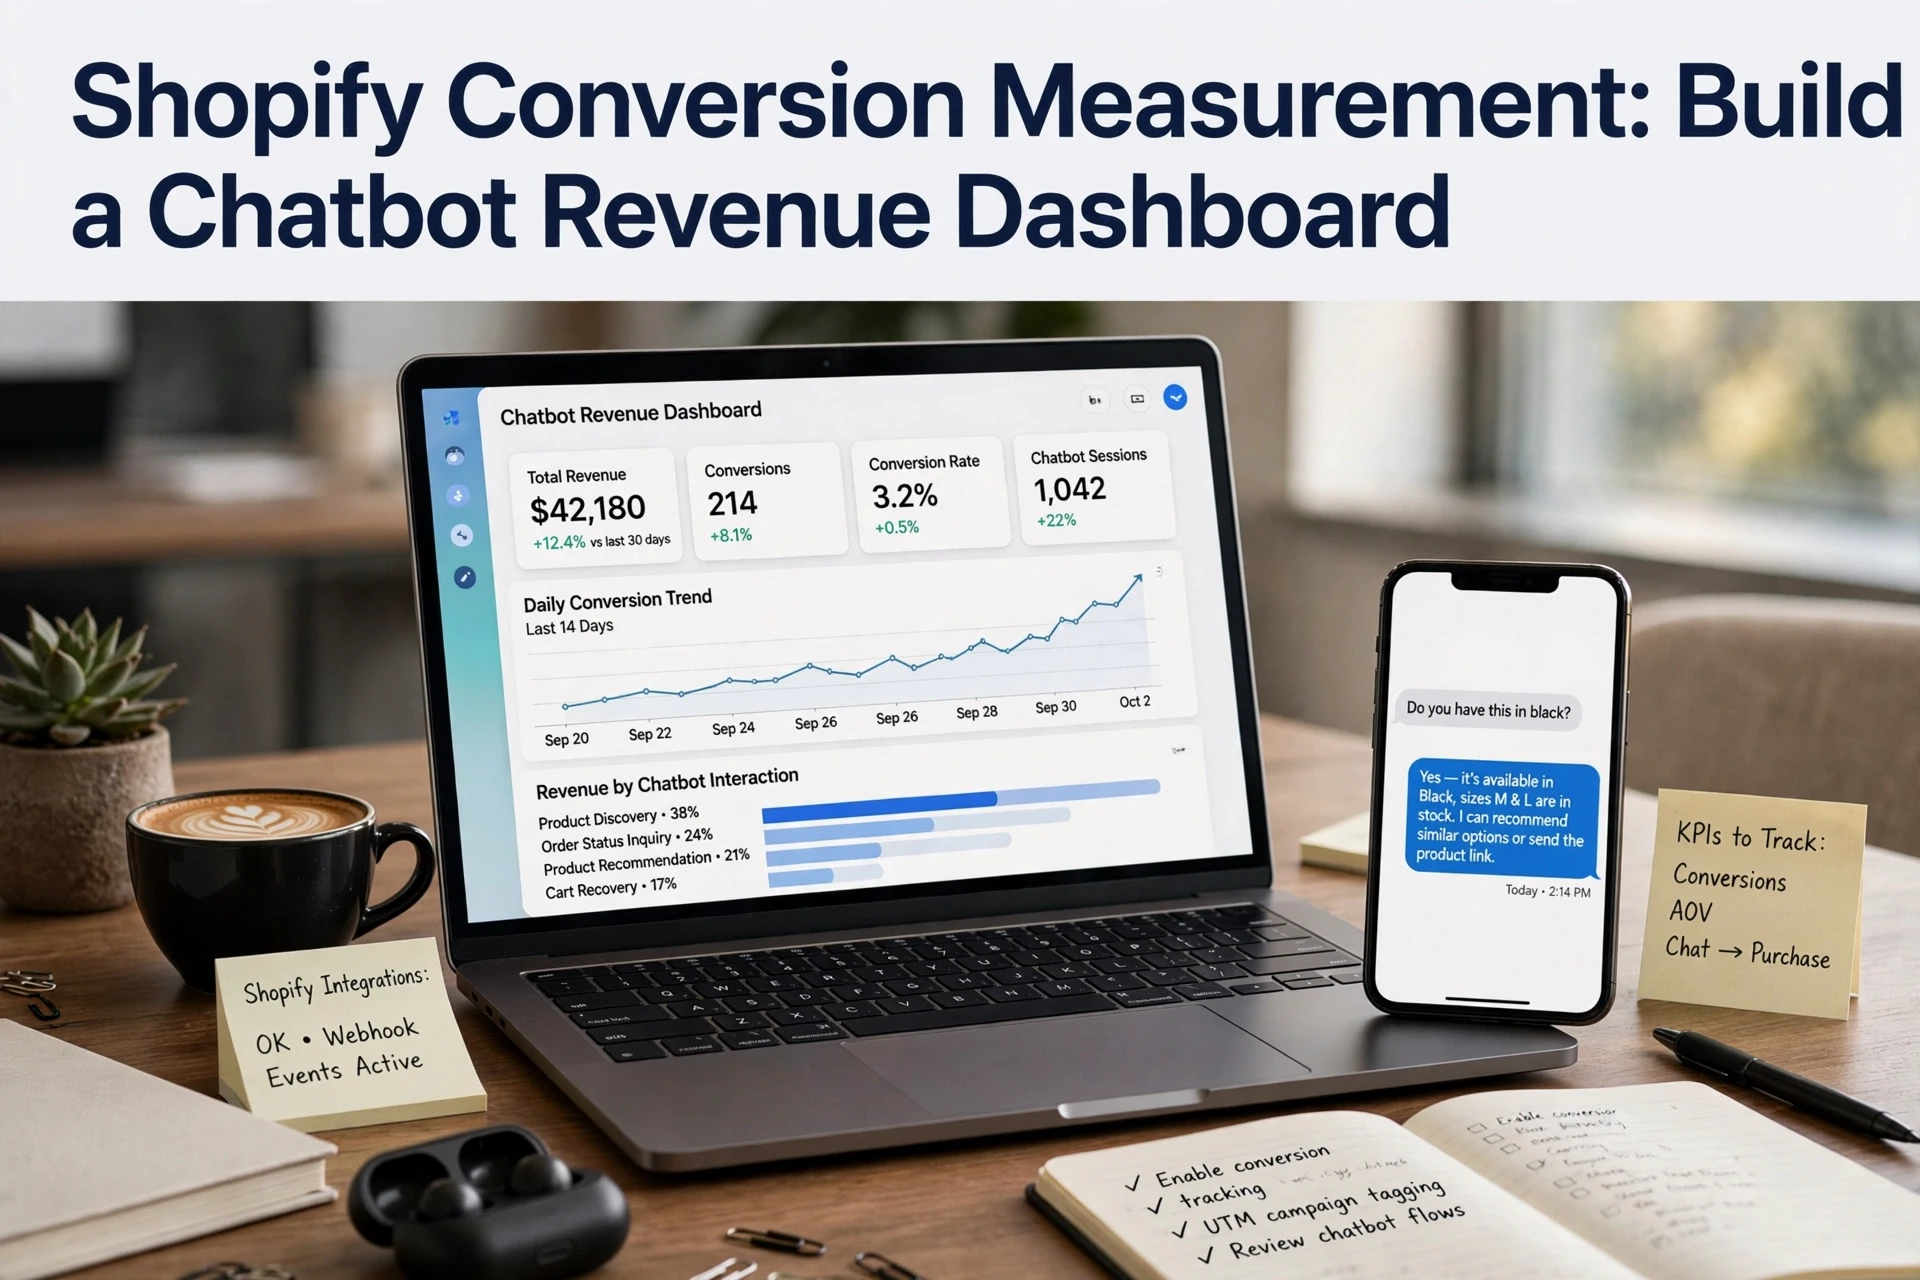
Shopify Conversion Measurement: Build a Chatbot Revenue Dashboard
Quick Summary: Build a Shopify chatbot revenue dashboard by tracking attributed revenue separately from true incremental lift, since most teams see 60-80% attributed revenue but far smaller real lift. Connect chat sessions to orders using session IDs matched through Shopify's cart token and Order object, then drop any order that fails time-window, product-overlap, or dedupe checks. Keep the dashboard to five to seven clearly defined metrics like chat sessions, engaged sessions, attributed orders, and attributed revenue, and review it weekly rather than hourly. Kandid is pitched at the end as a tool for tracking attributed revenue and product recommendations.
One order might start with a product-recommendation chat. Another comes after a support question. A third skips your chatbot entirely. A good Shopify chatbot revenue dashboard shows those paths clearly, without assuming every sale the chat touched was caused by the chat. That is the exact problem this guide solves: you will learn which metrics to track, how to separate attributed revenue from real lift, and how to build the dashboard in under an hour.
Step 1: Define What Counts as Chatbot-Attributed Revenue
Pick a definition before you build your Shopify chatbot revenue dashboard, or every number on it will mean something different each week.
Separate Association From Causation
Two numbers matter here, and they are not the same. Attributed revenue is the revenue from orders where a shopper touched the chatbot first, viewed a product link it sent, or chatted before checkout. Tools like Shopify's analytics reports track sessions and sales, so you can filter orders by chatbot-assisted traffic.
Incremental lift is different. It asks: did those shoppers buy because of the chatbot, or would they have bought anyway? Attribution tells you what happened; lift tells you what the chatbot caused. You estimate lift with a holdout test - show the bot to only half your traffic, then compare. Label both numbers clearly in your dashboard so nobody treats "assisted" as "caused."
💡 Tip: Most teams see 60-80% attributed revenue but far smaller true lift. Both belong on your dashboard - just name them honestly.
Step 2: Connect Conversation Events to Shopify Orders
Validate the Match Before Reporting
Your Shopify chatbot revenue dashboard is only as good as its joins. Each conversation needs a key that ties it to an order. Most chatbots fire an event with a session ID, and checkout passes that value into the order as a note attribute or cart token. Shopify's Order object exposes the cart token and attribution fields, so you can match sessions to orders after checkout.
Pull the matched orders with the Orders API, then check three things:
- Time window: order placed within your chosen window, say 24 hours after chat
- Product overlap: bought item matches what the chatbot recommended
- Dedupes: one session linked to multiple orders, or two sessions claiming one order

Drop any order that fails a check. A weekly spot check of ten matches keeps bad joins out of your totals.
Step 3: Build a Compact Dashboard Around the Funnel
Choose Metrics With Unambiguous Definitions
Pick five to seven numbers. More invites arguments about what counts.
| Metric | Definition | Source |
|---|---|---|
| Chat sessions | Unique chats started in the period | Chatbot tool |
| Engaged sessions | Chats with at least one shopper reply | Chatbot tool |
| Attributed orders | Completed Shopify orders linked to a chat | Shopify Analytics |
| Attributed revenue | Order value from those orders, post-refunds | Shopify Analytics |
| Conversion lift | Difference vs. a matched non-chat group | Your test setup |
Write each definition in one sentence on the dashboard itself. "Order value from attributed orders after refunds" beats "revenue" every time, because refunds change the number weekly.

Review it weekly for a month, then switch to monthly. Small stores need longer windows; daily numbers will just bounce around.
Next, track assisted order value the same way, so average basket size gets equal billing with order count.
Step 4: Review Trends and Report Limitations
Read your dashboard weekly, not hourly. One good or bad day means little. Look for patterns: which products the chatbot recommends most, when handoffs spike, and whether attributed revenue grows month over month. A Shopify sales report can back this up with order-level detail.
Then state the limits when you report results. Chatbot-attributed revenue shows what the chatbot touched, not what it caused. Some buyers would have converted anyway. Pair the dashboard with a simple holdout or judgment call on lift before you scale spend or headcount on chat.
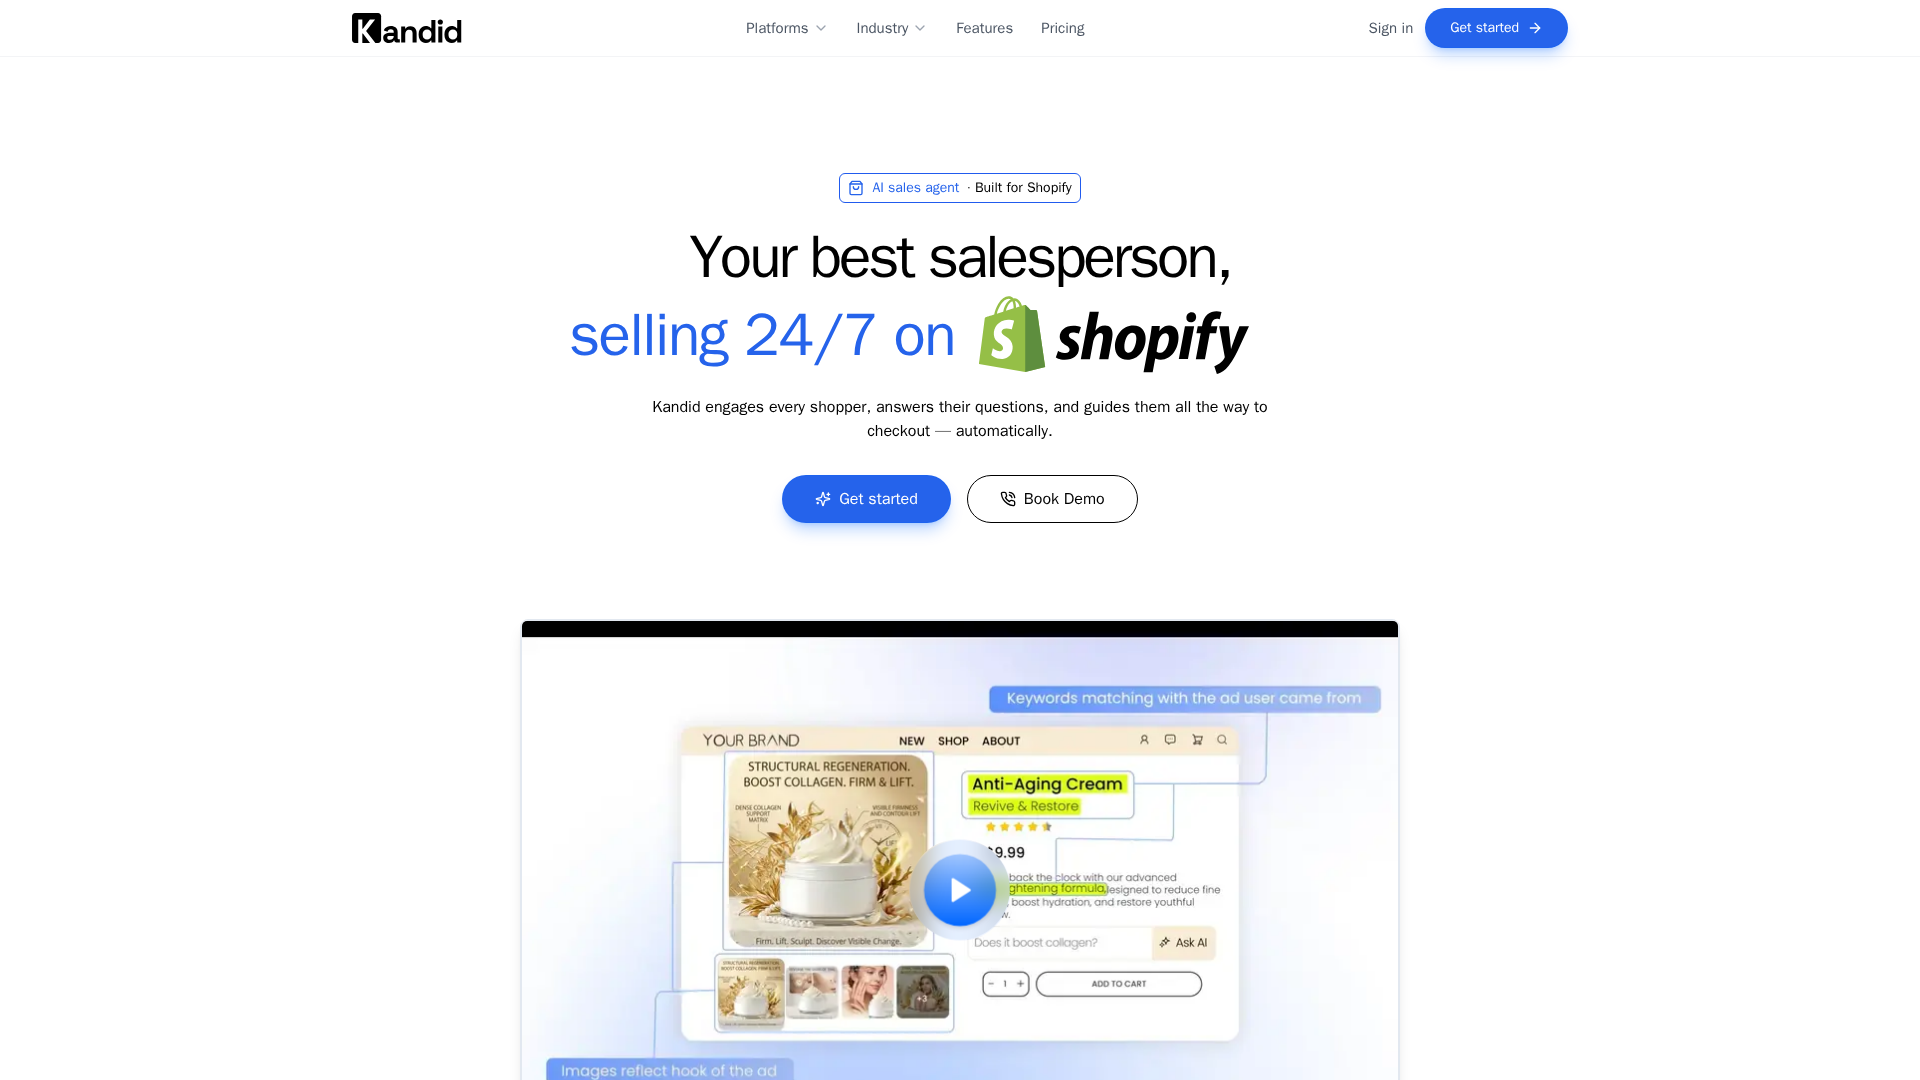
You now know which chatbot metrics matter. Put them to work: see how Kandid tracks attributed revenue and product recommendations for your Shopify store, then explore the AI sales agent in action.
Frequently Asked Questions
Q1: How can merchants build a Shopify chatbot revenue dashboard?
Use Shopify Analytics plus your chatbot's reports. Track attributed revenue, assisted chats, and conversion rate in one view.
Q2: Does chatbot revenue equal extra sales?
No. Attributed revenue shows involvement, not lift. Compare against periods without the chatbot.
Q3: Which metrics matter most?
Chat-to-order conversion, attributed revenue, and average order value from chat sessions.
Conclusion
A chatbot revenue dashboard comes down to three things: track attributed revenue with Shopify's own reports, define your metrics before you build, and separate attribution from true incremental lift so the numbers you report are honest.
(~31 words)