Shopify Conversion Metrics Every Store Should Track

Quick Summary: Shopify merchants should track seven metrics monthly: conversion rate, sessions, add to cart rate, average order value, revenue per visitor, cart abandonment rate, and customer acquisition cost. Segment results by traffic source, device, and new versus returning visitors before acting, and compare each month with the same period last year rather than generic benchmarks because Shopify changed its session measurement in September 2026. Chatbot revenue also needs its own attribution setup, such as UTM tags and a chatbot sales report, to avoid missing cross-device purchases or double-counting recovered discounts.
Two Shopify stores can post the same conversion rate in your admin and still behave very differently. One number comes from 1,000 sessions on a single paid Instagram campaign. The other blends branded, email and direct traffic. This guide walks through the Shopify conversion metrics worth tracking, where each one lives in your analytics, and the measurement quirks that trip up most merchants.
Which Shopify Conversion Metrics Should Every Store Track?
Track these seven Shopify conversion metrics: conversion rate, sessions, add to cart rate, average order value, revenue per visitor, cart abandonment rate and customer acquisition cost. Together they show where the funnel leaks and which fixes move revenue, not just traffic.
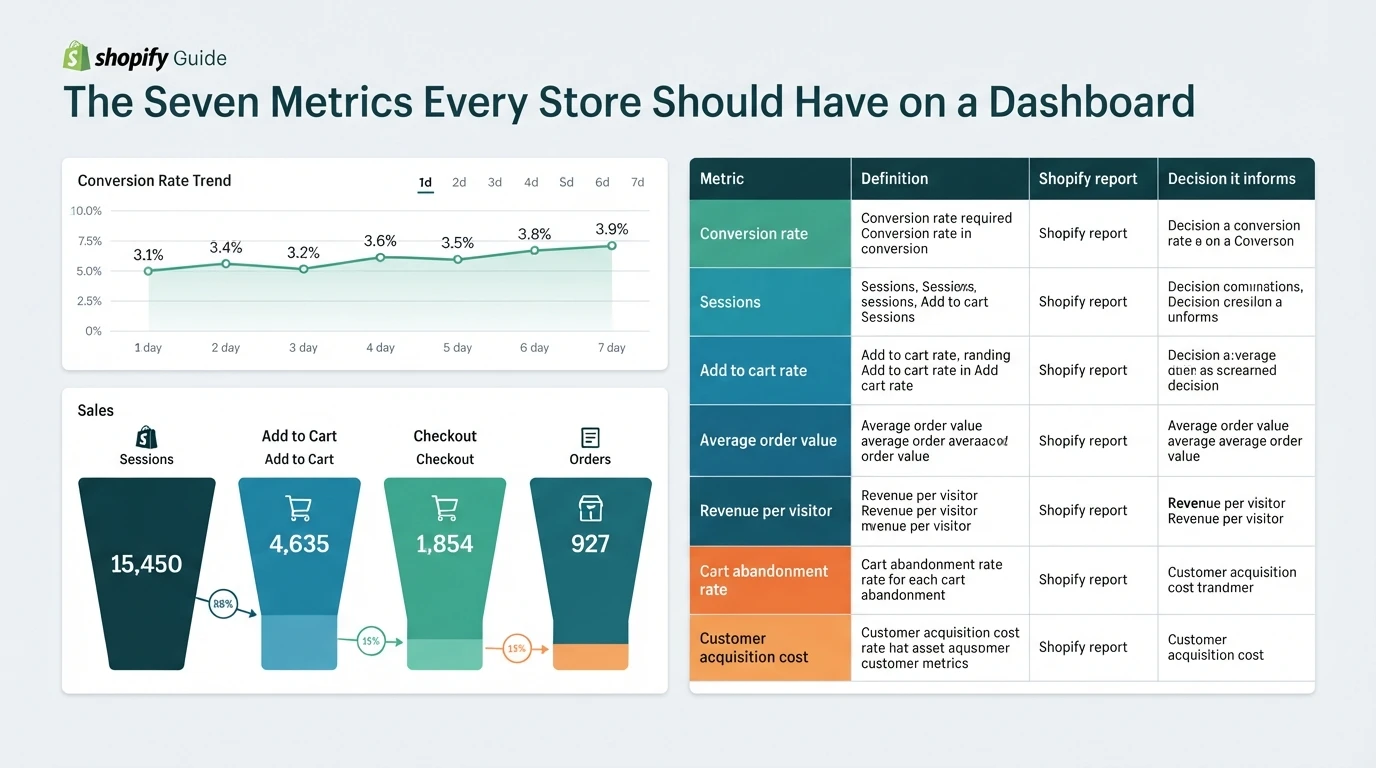
The Seven Metrics Every Store Should Have on a Dashboard
| Metric | Definition | Shopify report | Decision it informs |
|---|---|---|---|
| Conversion rate | Sessions ending in checkout | Analytics > Reports | Overall store health |
| Sessions | Visits counted by Shopify | Online store dashboard | Traffic trends |
| Add to cart rate | Sessions with a cart add | Sales funnel report | Product page quality |
| Average order value | Revenue per order | Sales by product | Bundles and pricing |
| Revenue per visitor | Revenue divided by sessions | Custom report | Where to invest |
| Cart abandonment rate | Carts not converted | Abandoned carts | Recovery emails |
| Customer acquisition cost | Spend per new customer | Marketing reports | Budget allocation |
Which of These Shopify Reports You Can Trust as Native
| Question | Native Shopify report |
|---|---|
| Cart abandonment vs checkout abandonment? | Cart abandonment counts unconverted carts; checkout abandonment counts sessions that started checkout and stopped |
| Are these reports reliable? | Yes for trends, but Shopify changed session measurement, so compare dates carefully |
Methodology changes matter here: Shopify's September 2026 session update shifted conversion rate and eight other metrics, so month-over-month charts can mislead if you mix eras, as this session measurement breakdown explains. For revenue tied to chat, chatbot sales attribution needs its own setup beyond native reports.
Where to Find Each Conversion Metric in Shopify Analytics
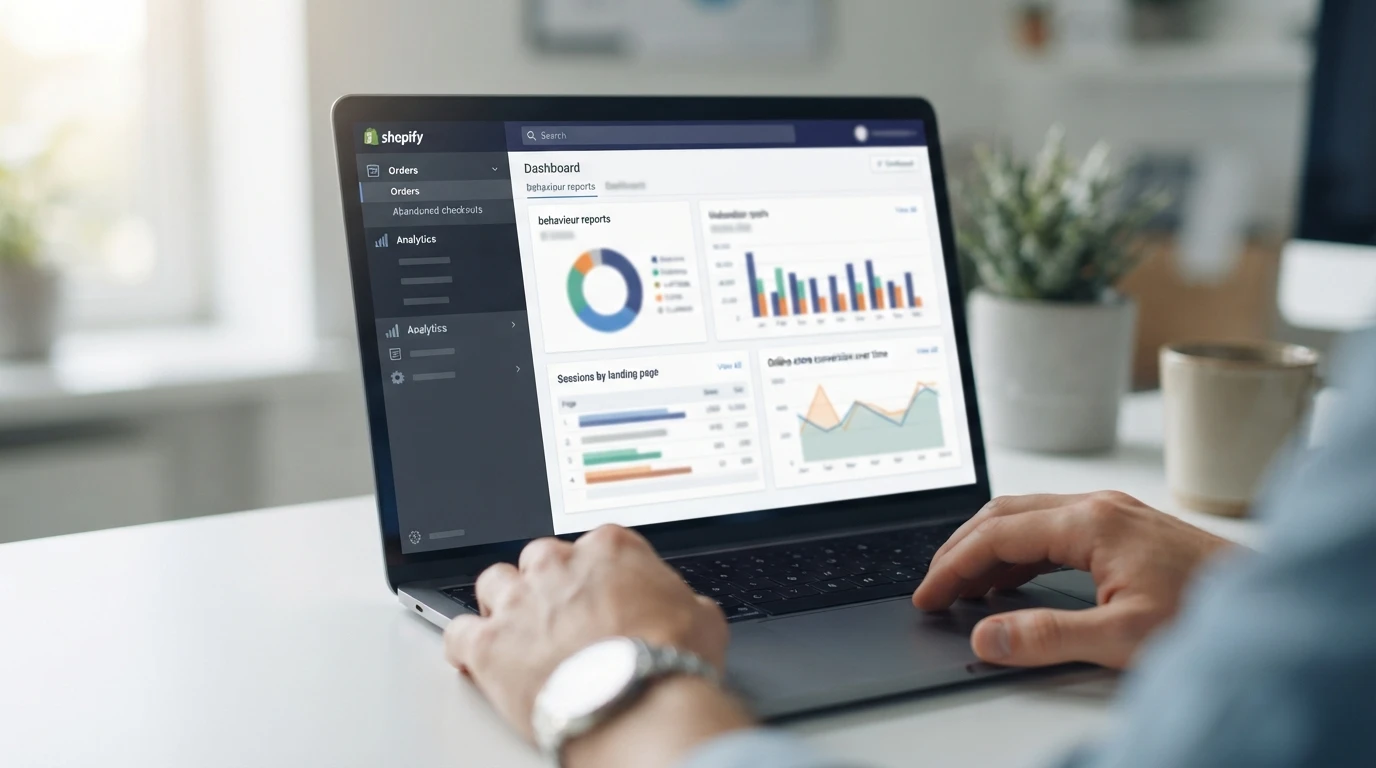
Where do I find abandoned checkouts and cart abandonment data in Shopify? Open Orders > Abandoned checkouts in your admin for the list of unfinished checkouts. For cart and session behaviour, go to Analytics > Reports and use the behaviour reports, such as Sessions by landing page and Online store conversion over time.
Analytics > Reports: The Conversion Funnel and Conversion Rate Breakdown
The Sessions converted report and the Online store conversion funnel show how sessions move from visited site to add to cart, reached checkout and converted. Open Analytics > Reports, search "conversion", and Shopify lists each report. Filter by date, device or traffic source to spot where shoppers drop off.
Sales by Traffic Source and Marketing Reports
For conversion rate by traffic source, open Analytics > Reports and run Sessions by referrer or the Sales attributed to marketing report under Acquisition. These show which channels actually produce orders, so you can compare paid and organic performance. Pair these reports with revenue numbers before shifting budget between channels.
Segmenting Metrics So the Numbers Actually Mean Something
Returning Versus New Visitors and Mobile Versus Desktop
To segment Shopify conversion data by traffic source and device:
- Open Analytics in your admin and pick Reports.
- Use Sessions by traffic source for the source split.
- Open Sessions by device for mobile versus desktop.
- Compare conversion rate across each segment.
Returning visitors convert far better than new ones, and mobile traffic converts worse than desktop, so blends hide both.

Reading the Numbers Against Your Own History First
Published ecommerce conversion rate benchmarks mislead because store mix differs. Compare this month against the same month last year instead. Segment shifts also matter when you measure chatbot revenue attribution, since device and source changes move numbers without any real improvement in your funnel.
From Metrics to Decisions: A Monthly Review Routine
How do I attribute revenue to an AI sales agent or chatbot? You attribute revenue by tracking orders that started in, or were influenced by, a chat conversation, using Shopify Analytics UTM tags and your chatbot's own sales report.
Attribution limits to keep in mind:
- Order versus checkout attribution changes which order a chat session gets credit for.
- Shoppers who chat, then buy later on another device, often go uncounted.
- Discounts through abandoned checkout recovery can double-count revenue.
Block one hour each month: compare chat-sourced orders against overall revenue, check revenue per visitor, and note trends before you change budgets or bot scripts.

Tracking these metrics shows where shoppers drop off. Kandid's AI sales agent for Shopify helps answer buyer questions and guide product discovery before they leave.
Frequently Asked Questions
Q1: Which Shopify conversion metrics should every store track?
Track conversion rate, sessions, add to cart rate, average order value, revenue per visitor, cart abandonment rate and customer acquisition cost. All live in Analytics > Reports and show where your funnel leaks.
Q2: How often should I review these metrics?
Monthly works for most stores. Block one hour, compare against the same month last year, and check segments before changing budgets or bot scripts.
Q3: Why does my conversion rate look different after Shopify's session update?
Shopify changed how it counts sessions in September 2026, shifting conversion rate and other metrics. Compare date ranges carefully so old and new methodology don't mix.
Conclusion
Track the seven Shopify conversion metrics monthly, segment before you judge, and compare against your own history rather than benchmarks. Watch session methodology changes and chatbot revenue attribution closely, so your funnel decisions rest on clean, trustworthy numbers.