Ecommerce Chatbot Analytics Dashboard Guide for Shopify Merchants
Quick Summary: Build your Shopify chatbot dashboard around commercial outcomes, not just chat counts. Track chat-influenced orders, product clicks, and revenue, then split attribution into sourced, assisted, and incremental buckets so you avoid double-counting. Pair revenue with CSAT and resolution rates, and review weekly to fix top unanswered questions. Gorgias data shows assisted orders run 47% higher in value, so focus on discovery and conversion, not vanity engagement.
A shopper asks your chatbot about jacket sizing, clicks a recommendation, then buys in a new session the next day. If your dashboard only logs the conversation, you cannot tell if the assistant helped that sale. This guide shows you how to build an ecommerce chatbot analytics dashboard for Shopify that ties chats to product discovery, conversions, and revenue. We wrote it for merchants running AI sales assistants who want defensible attribution, not vanity chat counts.
Track the Shopper Journey, Not Just Chat Volume
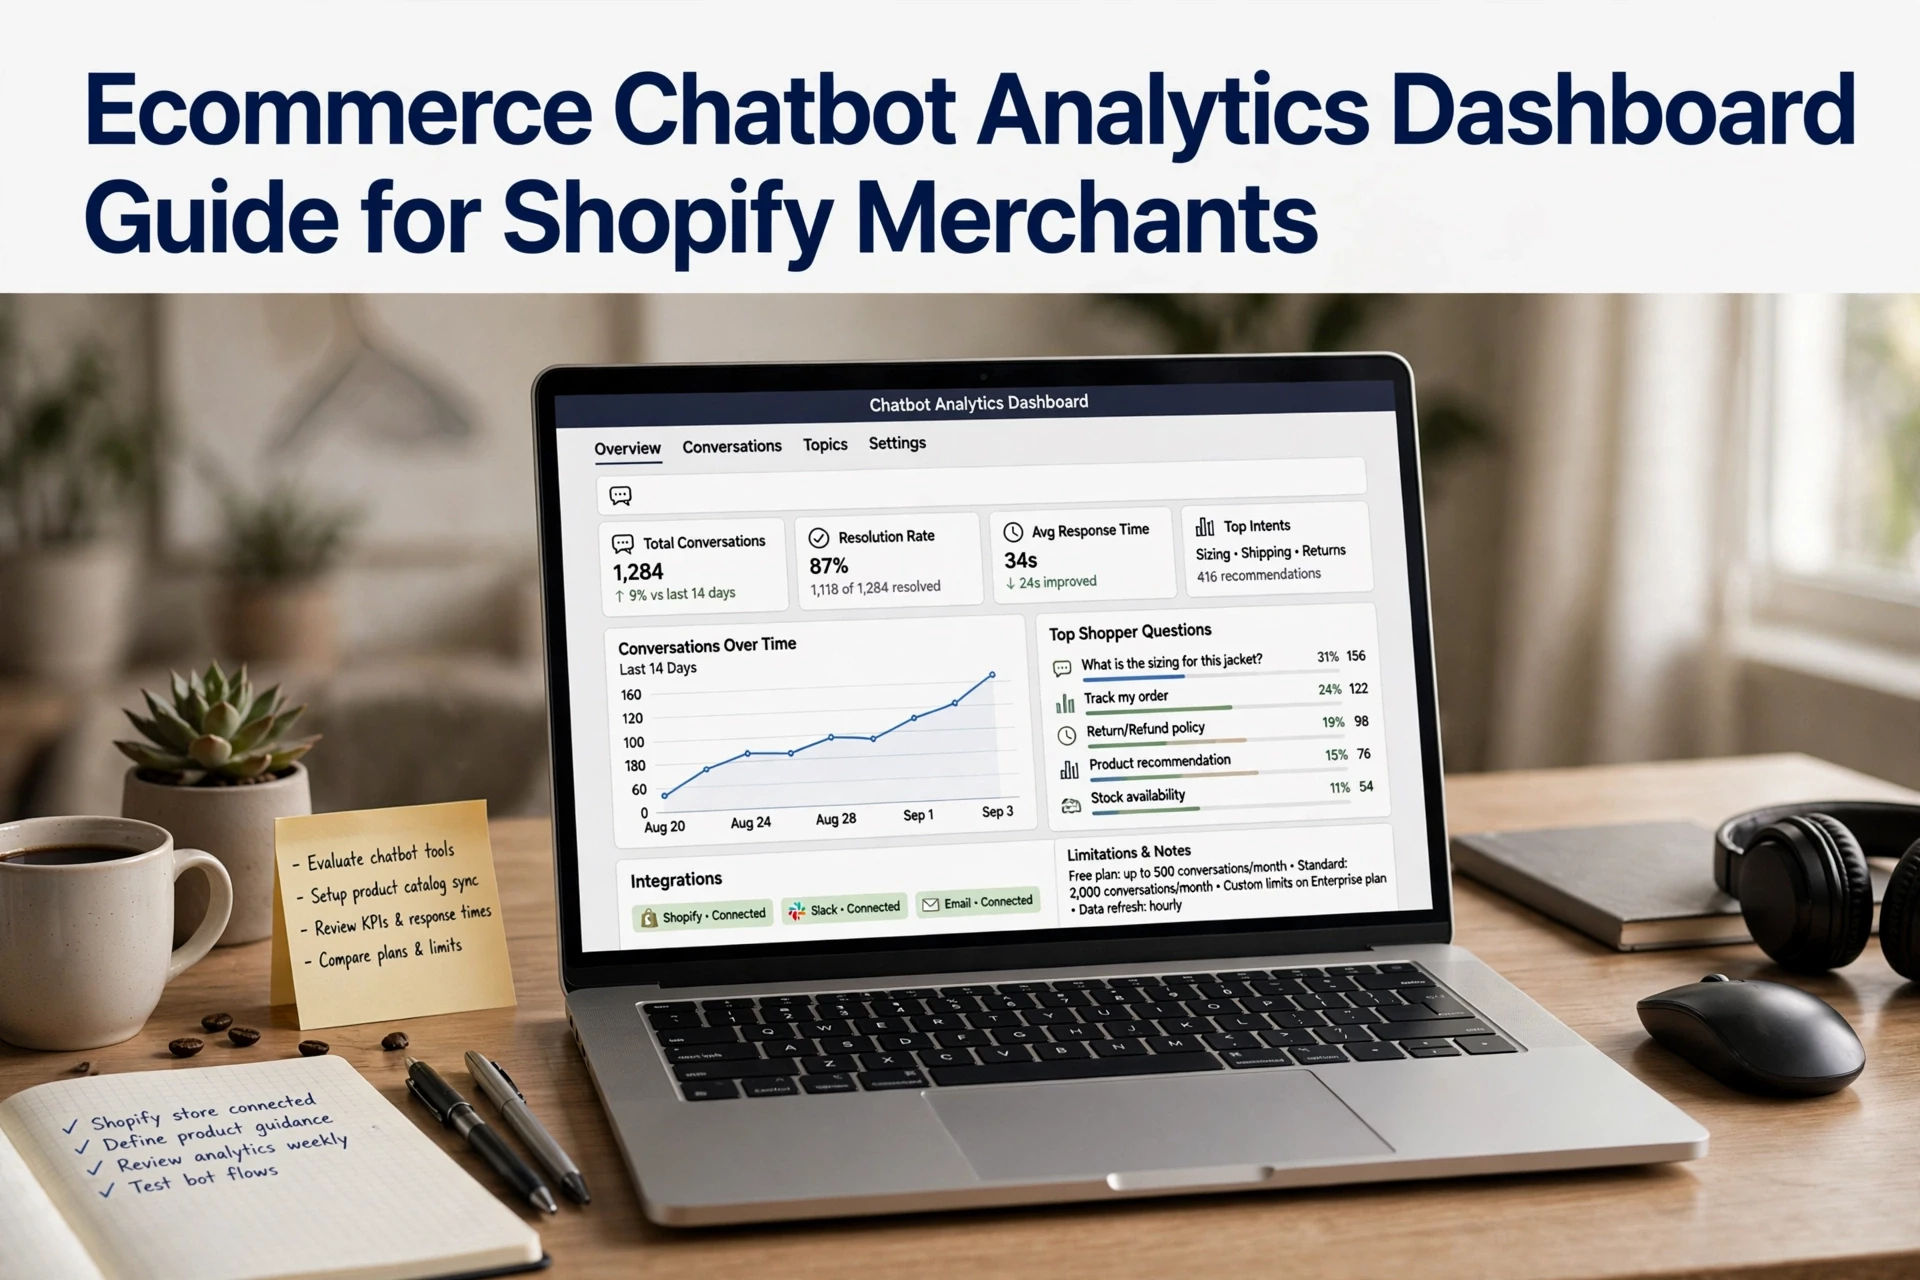
Chat counts tell you the bot is busy. Your ecommerce chatbot analytics dashboard should tell you what shoppers did next. Shopify's own funnel moves from sessions to cart, checkout, and purchase, and the gap between each step is where revenue hides.
Core Events to Capture
Log these chat-driven events and match them to orders:
- Chat opened per session and per product page
- Questions asked (sizing, shipping, stock)
- Product recommended by the bot
- Clicked a recommendation and added to cart
- Reached checkout and completed purchase
Shopify's behavior reports already track cart additions and checkout steps, so tie chat events to the same funnel.
Useful Segments for Shopify Merchants
Split data so patterns show up: chatters vs non-chatters, mobile vs desktop, and first-time vs returning buyers. Then compare conversion rate and AOV per segment. If chat users convert at similar rates to everyone else, your bot answers questions but isn't driving discovery.
Measure Product Discovery and Conversion Outcomes
Engagement numbers flatter every chatbot. Revenue numbers do not, so your dashboard should lead with commercial outcomes.
Commercial Metrics Worth Tracking
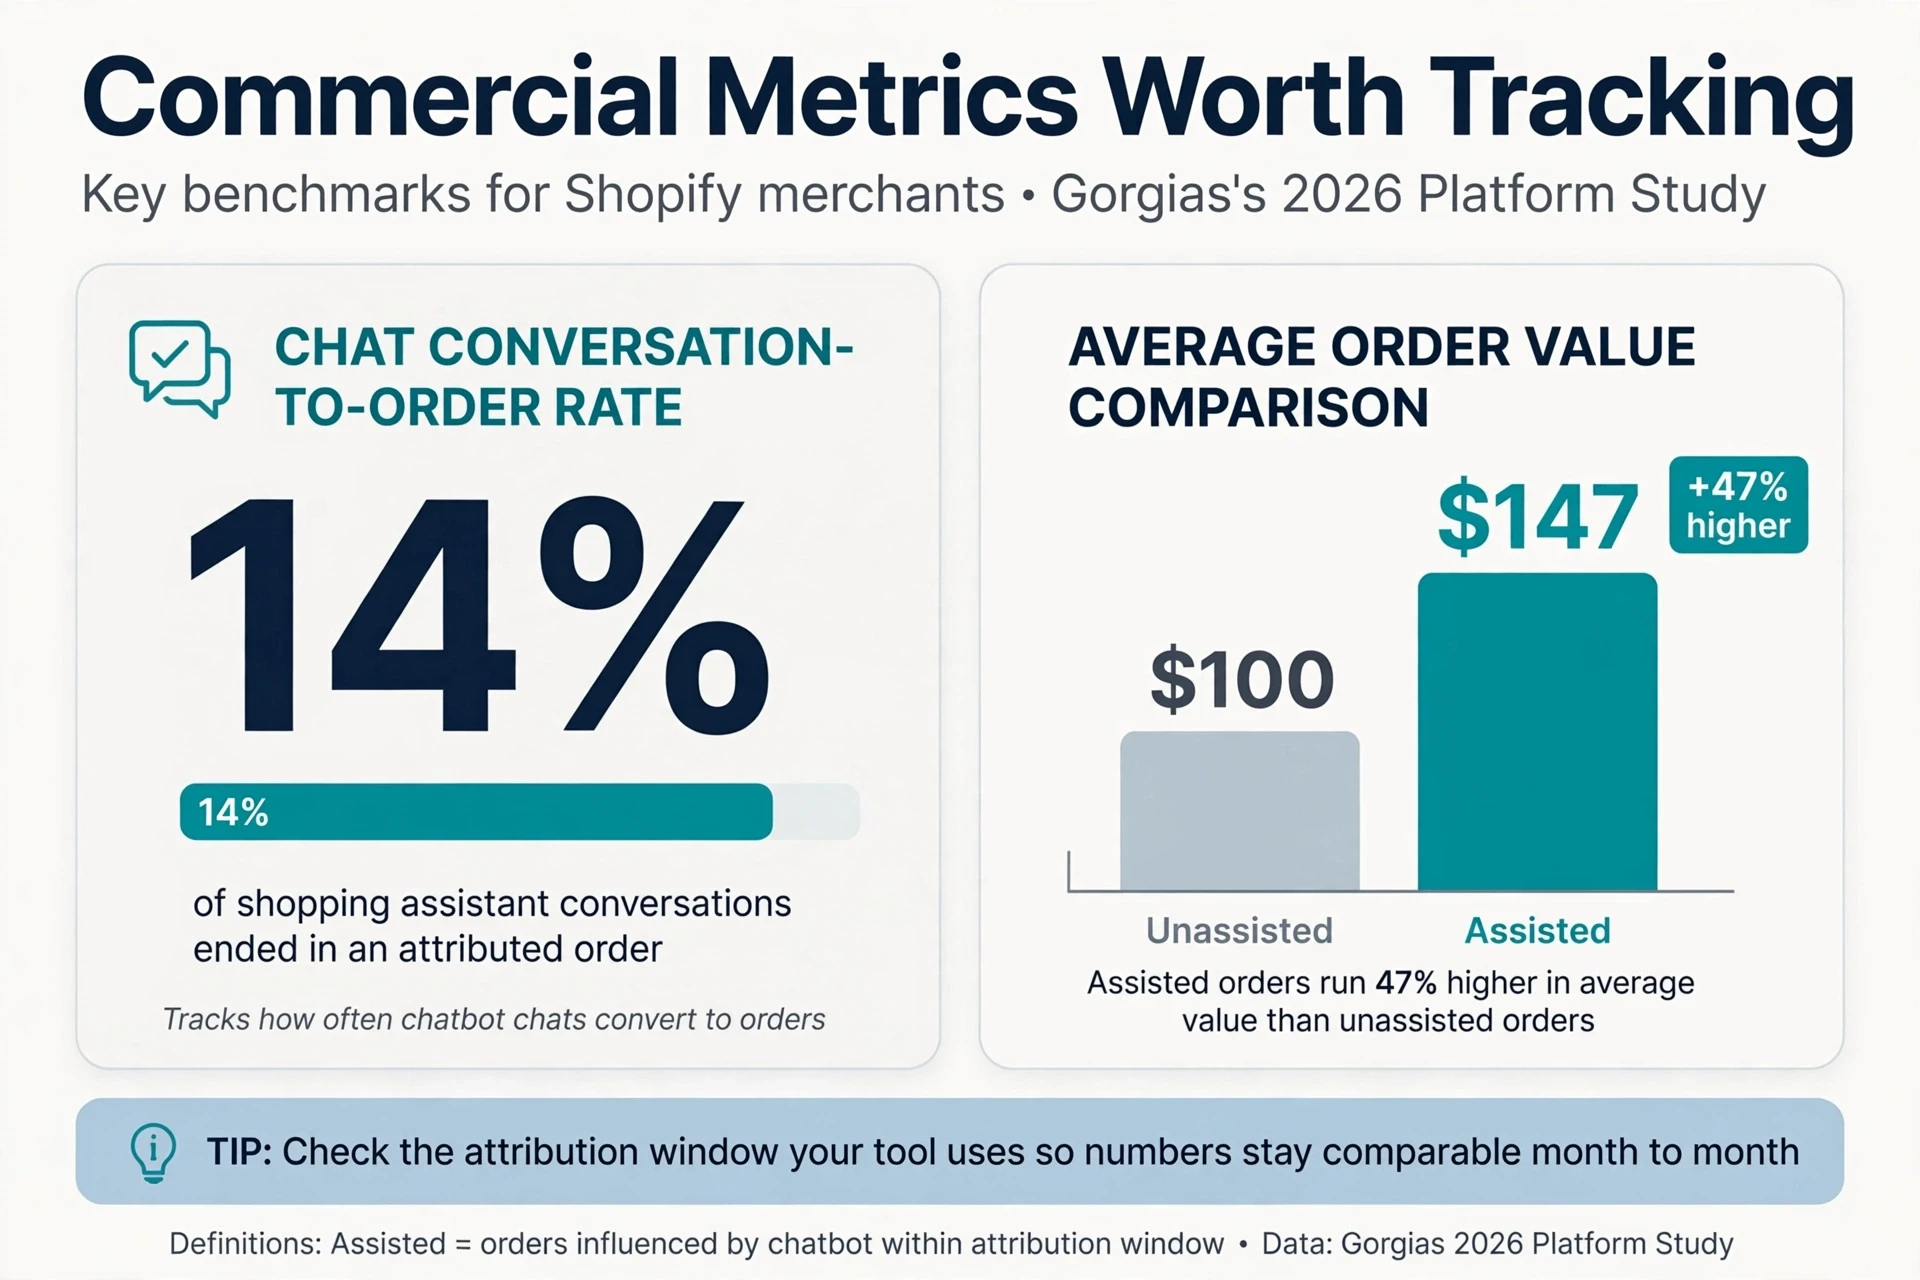
Watch four numbers: chat-influenced orders, average order value on assisted orders, revenue share from chat, and recommendation click-through. Gorgias's 2026 platform study found about 14% of shopping assistant conversations ended in an attributed order, and assisted orders ran 47% higher in value than unassisted ones. Check the attribution window your tool uses so numbers stay comparable month to month.
Product and Question-Level Insights
Commercial metrics tell you the "what." Question data tells you the "why."
- Top products mentioned or recommended in chat
- Questions the bot answered well versus deflected to a human
- Unanswered questions, which reveal missing catalog details
- Recommendation click rates by product pair
Feed the gaps back into your product pages. Tools like Rep AI and Zipchat AI surface similar reports, so compare what your tool actually exports before committing.
Also Read: How to Measure Ecommerce Chatbot Revenue Attribution
Pair Revenue Metrics With Service Quality
Revenue numbers mean little if the chatbot annoys people. Report them side by side.
Quality and Handoff Metrics
Watch CSAT after chat sessions, resolution rate (issues actually solved, not just closed), and repeat contact rate. A deflection number can rise while customers quietly fail to get help, which is why CorePiper's 2026 analysis calls deflection a vanity metric worth dropping. Also track handoff quality: customers whose escalation carries full context rate the experience about 14% higher than those who repeat themselves to a human.
Turn Dashboard Signals Into Actions
Review weekly:
- Flag chat sessions where CSAT dips below 4/5.
- Fix the top three unanswered questions.
- Check that handoffs pass order details to your team.

Also Read: AI Sales Agents: 7 Metrics to Prove Revenue Impact
Use Attribution Rules You Can Defend
Pick one model and stick to it. Google Analytics now defaults to data-driven attribution, which splits credit across touchpoints, while last-click gives 100% to the final non-direct click. Both are valid. Mixing them in one report is not.
Separate Sourced, Assisted, and Incremental Revenue
Split chatbot revenue into three buckets:
- Sourced: the chat session was the last touch before purchase.
- Assisted: the shopper chatted earlier, then converted later.
- Incremental: tested with a holdout group, so you know the chatbot caused the sale, not just touched it.
Label every number on your dashboard with its bucket. Never add them together - that double-counts.
Last-click over-credits the closing channel and gives zero credit to discovery. Report sourced and assisted side by side before you judge the chatbot.
Dashboard Disclosure Checklist
- State the attribution model on every report.
- Note the lookback window in days.
- Mark holdout-based figures as incremental.
- Show sample size and date range.
- Flag low-volume months as unreliable.
Document your rules once. Then anyone - your CFO, your agency, your co-founder - can audit the numbers without asking how you got them.

Ready to turn chatbot data into decisions? See how Kandid tracks product discovery, conversions and support quality on one dashboard.
Frequently Asked Questions
Q1: What should an ecommerce chatbot analytics dashboard track on Shopify?
Focus on revenue attributed to chats, product clicks from recommendations, top questions asked, handoff rate to humans, and resolution time.
Q2: How do I attribute sales to my chatbot?
Track orders where the shopper clicked a product link or purchased during or shortly after a chat session.
Q3: Which metric matters most: engagement or conversion?
Conversion. Chats that end without a click or sale usually signal weak product guidance, not low engagement.
Conclusion
A good dashboard tracks outcomes, not chat volume: conversion, containment, CSAT, and attributed revenue. Data from Rep AI's shopper behavior report shows chat-engaged shoppers convert far more often. Review these numbers weekly and fix gaps fast.